
AWS DevOps Agent vs Sherpa: we ran both on the same account
AWS shipped a DevOps agent. We provisioned it and ran it against ours.
On March 31, 2026, AWS made its DevOps Agent generally available — autonomous operations, multicloud, “up to 75% lower MTTR.” When a hyperscaler ships into your category, that is good news: the category stops needing a sales pitch. So we did the honest thing — we stood the agent up in our own AWS account and asked both it and Sherpa the same 20 observability questions about the same live environment.
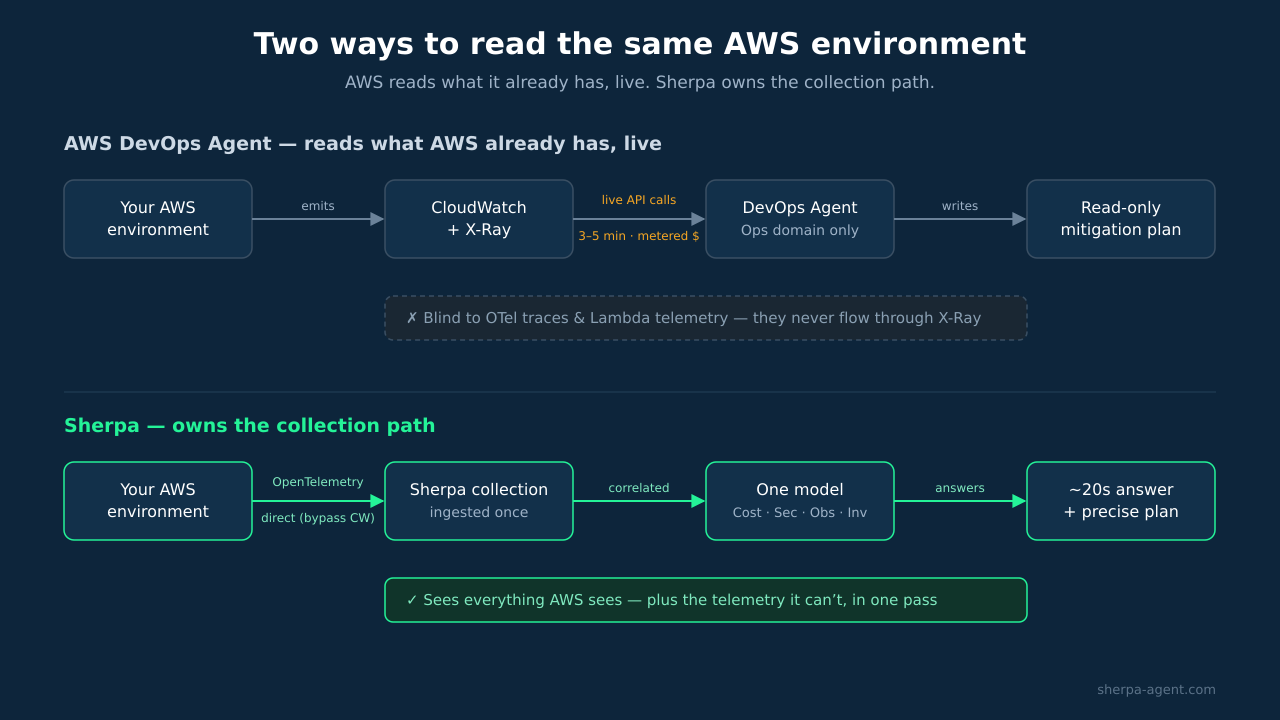
This is not a “we beat AWS” post. The two tools are built on opposite ideas, and that one difference explains everything we measured: AWS’s agent reads what AWS already has, live. Sherpa owns the collection path.
”Autonomous” — of investigation, not of the fix
Straight from AWS’s docs: the DevOps Agent investigates autonomously — it can kick off an investigation without a human prompting it, reason across signals, and find a likely root cause. Genuinely useful. But then:
- It produces “actionable mitigation plans” and “agent-ready instructions that can be implemented by another frontier agent, such as code improvements that can be implemented by Kiro.” It hands the fix off. It does not apply it.
- By default it is read-only. A session permission guardrail acts as a ceiling: even if your IAM grants write access, “write operations like
s3:PutObject,ec2:TerminateInstances, ordynamodb:DeleteItem… the agent cannot perform these actions.” Verbatim. - There is no auto-remediate mode. The only place AWS executes a fix is a different product — CloudWatch investigations — and only after a human clicks Execute on a blast-radius preview, running a pre-authored SSM runbook under their own permissions.
So “autonomous” means the investigation starts on its own — not that the system fixes anything on its own. AWS writes you a plan. Someone still has to do the work.
Both write a plan — ours is the more precise one
Here is the honest version, because it matters. Today, both agents stop at a recommendation, not an applied fix — AWS by that hard read-only guardrail, Sherpa because applied remediation is on our roadmap (Sherpa Automate is “Recommend” today). So the fair question is not “who executes.” It is whose plan you would actually want.
We ran that test. On the same failing pipeline, Sherpa Automate diagnosed the precise fix: a cross-account permission failure that needed a change on both sides — the calling role’s missing permission and the target role’s trust policy — with a rollback pre-check and a verification step. AWS’s agent, on the same class of problem, leaned toward a more generic operational note and, asked to triage, led with a config recommendation rather than the pipeline that was actually failing on every run.
Both hand you a plan. Ours named the exact change. (And when applied remediation ships, that is the plan we will execute — with your approval.)
We ran both on the same account — what we measured
Twenty observability questions, same dev account, same moment. The pattern was consistent.
We see the traces it can’t. We asked both for our slowest operation. Sherpa answered from the OpenTelemetry traces it collects (a specific endpoint, p95 ~10.5s). The DevOps Agent came back empty: it reads AWS X-Ray, and like many teams we send traces over OpenTelemetry straight to Sherpa, not into X-Ray. The agent wasn’t wrong — it just can’t see telemetry that never flowed through AWS’s own services. We don’t push our traces into CloudWatch or X-Ray, so we keep what they can’t read.
Same story for Lambda. Asked which functions were failing, Sherpa surfaced seven erroring functions with their root causes (read from the function logs and the OTel Lambda extension we collect directly); the agent flagged one. We read the failures we collect; it reads the AWS-native signals you may not be emitting.
We answer in seconds, not minutes. Sherpa’s answers landed in ~20 seconds because the data is already ingested. The DevOps Agent took 3–5 minutes per question — it is making dozens of live AWS API calls each time, and it meters at $0.0083 per agent-second while it does. Pre-ingested is faster, and far cheaper to ask.
Where we agreed, we agreed exactly. On the dead-letter-queue question, both found the same backlog of stuck messages — down to the number. We are not cherry-picking; on the shared, AWS-native signals, the two tools match.
And one place the live-API model reached further — for now. The DevOps Agent flagged a service down in another region and a container restart loop that Sherpa did not surface — control-plane state (execution status, task restarts) that isn’t a metric, log, or trace. That is the right catch. It is also why we are putting control-plane state into our pipeline: ingested once and correlated instantly with everything else, instead of re-fetched live on every investigation. The signal belongs in the pipeline, not in a per-incident API sweep.
One domain, by design — and the cross-domain gap
AWS ships a suite of single-domain agents — DevOps Agent (ops), FinOps Agent (cost, preview), Continuum (security, preview). Three agents, three consoles, three meters. None reasons across cost + security + observability in one pass. But incidents don’t respect that boundary: the runaway workload paging your on-call is also next month’s top bill line; the idle load balancer you’d delete is still fronting an exposed workload. Sherpa reads cost, security, observability, and inventory in one model — so a single answer can say “this is also costing $X and exposing resource Y.”
The worked example: the incident hiding in the bill
We lived this. Our cost climbed about $750 a day with no traffic change; a pipeline got heavier; jobs went red — three tickets that looked unrelated. Untangled, it was one self-feeding loop: a job errored → became a log → we ingested it → ingesting re-ran the job → it errored again. A pure ops agent investigating “why are errors elevated” describes the symptom. The part that mattered — the errors were feeding their own ingestion, and the damage was on the cost line — only surfaces by reasoning over ops and cost at once. (Full post-mortem: our feedback-loop story.)
”Multicloud” — it can look, it can’t touch
Per AWS’s docs: for Azure, the agent “connects natively through Microsoft Entra ID to discover and investigate Azure resources” via Azure’s read-only Reader role. For on-prem, it “extends incident investigation” via observability tools and private MCP servers. GCP is not listed as supported. Read the verbs — discover, investigate. On non-AWS clouds it reads and reasons; it does not act. “Multicloud DevOps” is, precisely, “look at your other clouds from AWS.”
The part no ops agent mentions: what it costs to feed it
The agent meters at $0.0083 per agent-second (AWS’s own examples: ~$40/mo small team, ~$344 active, ~$2,366 enterprise) — and in our runs, a single deep investigation ran $1.50–$2.80 in agent-seconds alone. AWS is explicit that connected-service fees are not included: “You are responsible for fees… for example, Amazon CloudWatch Logs Insights queries or trace retrievals… billed through the respective services at standard rates.”
And there is the data-gravity pull. Its richest AWS-native analysis leans on telemetry resident in CloudWatch, which charges $0.50/GB just to ingest. Sherpa is the inverse: your apps and Lambda send telemetry directly to Sherpa over OpenTelemetry, bypassing CloudWatch ingestion; the only CloudWatch dependency is the handful of AWS-managed-service signals you can’t put an agent on. The act of observing isn’t the expensive part.
Deep capability comparison
| Capability | AWS DevOps Agent (+ CloudWatch investigations) | Sherpa |
|---|---|---|
| Autonomous investigation / RCA | Strong — starts on its own; NL hypotheses | Investigates + reasons across signals; ~20s answers (pre-ingested) |
| Plan vs. applied fix | Plan only — read-only guardrail; hands fix to human/Kiro | Plan only today (applied remediation on roadmap); the plan was more precise in our test |
| Sees your OTel traces / Lambda | No — reads X-Ray / CloudWatch; blind to OTel you don’t push there | Yes — collects OTel directly; sees traces + Lambda telemetry it can’t |
| Reasons across cost + security + obs + inventory | No — single-domain (DevOps/FinOps/Continuum are separate) | Yes — one model, all four |
| Control-plane state (exec status, exit codes) | Live AWS API calls (3–5 min, metered) | Going into our pipeline — pre-ingested + correlated |
| Cost model | $0.0083/agent-sec ($1.50–2.80/investigation measured) + connected-service fees | Platform subscription; telemetry collected in-product |
| Reported performance | ”Up to 75% lower MTTR / 94% accuracy” — AWS-reported preview figures | Answers verified byte-exact vs. our own data |
On performance and accuracy
We used to say we wouldn’t fake a head-to-head. Now we don’t have to — we ran one, in our own account, and we held ourselves to the standard we ask of any tool: every Sherpa answer in the benchmark was checked byte-exact against the underlying data before we trusted it. AWS’s headline numbers (75% MTTR, 94% accuracy) remain AWS’s own reported preview figures, not independent benchmarks; we cite them as AWS’s claims. The interesting version of this benchmark is the one run on your environment — we’ll do it live.
The point
AWS shipped a capable agent that investigates autonomously and writes you a plan, for one domain, reading the telemetry AWS already holds. That is genuinely useful. But it can only see what flows through AWS’s own services, it re-queries everything live (slow, metered), its sibling agents don’t share its reasoning, and it hands the fix off. Sherpa owns the collection path — it sees the OTel traces and Lambda telemetry the agent can’t, answers in seconds across cost, security, observability, and inventory together, and writes the more precise plan.
We ran this in the open, against AWS’s own agent and our own environment. The interesting version is running it on yours.
→ Early access: sherpa-agent.com?utm_source=blog&utm_medium=web&utm_campaign=launch-2026&utm_content=devops-agent-case-study
FAQ
Does the AWS DevOps Agent fix incidents automatically?
No. Per AWS’s docs it is read-only by default and produces mitigation plans plus instructions a human or another agent (Kiro) can implement; a session guardrail blocks all mutating API calls even if your IAM allows them. “Autonomous” refers to autonomous investigation, not remediation. The only AWS path that executes a fix is the separate CloudWatch investigations feature, after an explicit human click.
Can the AWS DevOps Agent see my OpenTelemetry traces?
Not unless they flow through AWS. It reads AWS X-Ray and CloudWatch. If your services send traces over OpenTelemetry to another collector — as many do — the agent can’t see them. Sherpa collects OTel directly, so it can.
Is the AWS DevOps Agent really multicloud?
It can investigate Azure (via a read-only Entra ID Reader role) and on-prem (via MCP), but it does not take action on non-AWS environments, and GCP isn’t supported. “Multicloud” here means cross-cloud investigation, not operation.
How is Sherpa different?
It owns the collection path — it sees OTel traces and Lambda telemetry AWS-native tools miss; it answers in seconds because the data is already ingested; it reasons across cost + security + observability + inventory in one model where AWS ships three separate agents; and when it recommends a fix, it names the exact change. Applied remediation is on our roadmap; today both tools write a plan.
What does it cost to run the AWS agent?
$0.0083 per agent-second (a deep investigation ran us $1.50–$2.80 in agent-seconds), plus connected-service fees billed separately — notably CloudWatch log ingest at $0.50/GB and per-query charges.
See what Sherpa finds in your AWS.